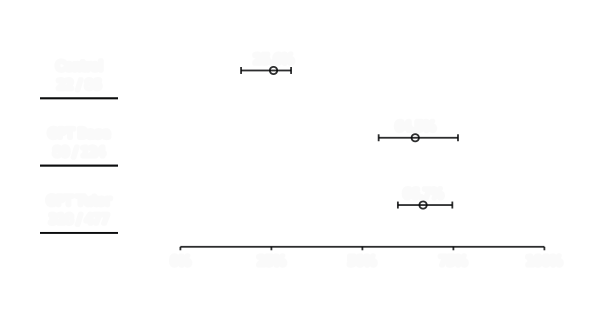
A practice score produced with assistance may be a weak basis for declaring independent readiness. We examine this question through an exploratory secondary analysis of a public randomized mathematics trial. The non-honors replication sample contains 2,899 student-session pairs from 839 students in 44 classrooms. Among sessions scoring at least 80% in practice, the later unaided exam scored below 50% in 25.6% of control sessions, 64.5% with GPT Base, and 66.7% with GPT Tutor. Classroom-bootstrap 95% intervals are 16.7–30.4%, 54.5–76.3%, and 59.7–74.7%, respectively. Both AI arms exceed control under all twelve tested threshold combinations. Because practice performance is affected by treatment, these conditional comparisons do not estimate causal effects of AI on learning. They instead identify a measurement problem: the same practice-score threshold selects different evidence of independent performance under different assistance conditions. We release aggregate results, analysis code, and original figures, and specify a prospective study that could test whether a short independent check improves readiness decisions.
A student finishes a mathematics practice set with 80%. The interface has a number; the teacher needs a judgment. Can this student solve the next problem without help? When a tutor contributed to the answers, those two things can come apart.
This article investigates that separation using released trial data. Its contribution is a new, reproducible analysis of the relationship between practice and subsequent unaided scores. The original experiment belongs to Bastani and colleagues; the conditional counts, sensitivity analyses, figures, and proposed follow-up below are our work. This is exploratory secondary research, produced with AI assistance, and has not been peer reviewed. It contains no new experiment or EuraStudy learner data.
The question behind an 80% score
Practice performance describes what happened under the conditions of practice. Readiness is an inference about what will happen under another set of conditions. A platform that moves directly from “80% correct” to “ready to proceed” is making that inference, even if it never calls it a prediction.
We ask a deliberately narrow question: among sessions with a high practice score, how often was the subsequent unaided exam score low? The primary rule defines high as at least 80% and low as below 50%. These are analyst-chosen audit thresholds. They are neither validated mastery standards nor the school’s passing rules.
The distinction between performance and learning is established in learning science: success during instruction need not identify a durable change in capability. 3 Our question turns that distinction into an observable audit of one dataset. It does not require deciding that every low exam score represents a failure to learn. It asks whether a specific practice threshold provides enough evidence to justify a specific readiness interpretation.
The answer is consequential even if AI helps students. An intervention can enable more learners to complete practice successfully while making a high practice score less selective for students already able to work independently. Better access to successful practice and weaker evidence from the practice score can coexist.
A public trial, a clearly bounded sample
Bastani and colleagues studied high-school mathematics in Turkey, assigning classrooms to control, GPT Base, or GPT Tutor. Both AI systems used GPT-4; the tutor added teacher-informed safeguards intended to guide learning. Students practiced with the resources allowed in their condition, then took an exam without resources. Control practice could use course materials, so “control” does not mean unaided at every stage. 1
We use the authors’ public replication file and match the non-honors restriction in their main analysis script. 2 The source contains 3,255 observed student-session pairs. Removing 356 honors observations leaves 2,899 pairs, 839 distinct students, and 44 classrooms. These are counts in the released analysis file, not the number initially enrolled. Students can contribute up to four sessions; a session pair is one practice score and its subsequent exam score.
| Assigned arm | Classrooms | Distinct students | Observed session pairs |
|---|---|---|---|
| Control | 17 | 320 | 1,076 |
| GPT Base | 13 | 242 | 838 |
| GPT Tutor | 14 | 277 | 985 |
| Total | 44 | 839 | 2,899 |
The released fields Part2Tot and Part3Tot already express scores as fractions between zero and one. We validate those bounds, require both scores, check for duplicate student-session records, verify the arm labels against the treatment indicators, and confirm that assignment is constant within each classroom. No missing score pair or duplicate appears in this source file. We retain observed sessions regardless of whether an assigned student used the AI.
That last point matters. Removing non-users would change the question from assignment to chosen behavior. We do not make that additional selection. However, using observed sessions already limits the population: absence and records not present in the released file are not silently reconstructed as zero scores or successful sessions.
What we actually calculate
For each assigned arm, let P be the practice score and E the subsequent unaided exam score. The main descriptive quantity is:
The denominator is high-scoring practice sessions, not all students, all sessions, or all examinations. A student who qualifies in two sessions contributes twice. The main estimate therefore describes an observed session selected by the practice rule. Later we repeat the calculation with each student contributing equal total weight. Exactly 80% qualifies; exactly 50% on the exam does not count as below the threshold. Comparisons allow a numerical tolerance of one trillionth to avoid treating floating-point noise as a score difference.
Three quantities belong together. The qualifying share says how often the practice threshold is reached. The conditional low-exam share is q. The joint share says how often both conditions occur among all observed sessions. Reporting only q would hide how much the size of the selected group changes.
| Assigned arm | Practice ≥80% | Of those, exam <50% | Conditional share, with 95% interval | Both conditions, as share of all sessions |
|---|---|---|---|---|
| Control | 86 / 1,076 (8.0%) | 22 / 86 | 25.6% (16.7–30.4%) | 2.0% |
| GPT Base | 124 / 838 (14.8%) | 80 / 124 | 64.5% (54.5–76.3%) | 9.5% |
| GPT Tutor | 477 / 985 (48.4%) | 318 / 477 | 66.7% (59.7–74.7%) | 32.3% |
In the guarded tutor arm, nearly half of observed sessions reach the practice threshold. Within that much larger group, about two in three subsequent exam scores are below 50%. In control, only about one in twelve sessions reaches the practice threshold, and about one in four of those has a low exam score.
This is the central result. An identical numerical practice rule selects groups with markedly different subsequent performance. A practice score cannot carry its assistance conditions invisibly into a claim of independent readiness.
The joint percentages answer a different practical question. If a dashboard applied this practice threshold to every observed session, the high-practice/low-exam combination would appear in 2.0%, 9.5%, and 32.3% of sessions across the three arms. These are not measured rates of dashboard errors: the trial did not test such a dashboard, and its exam threshold is not a validated readiness criterion. They quantify how often the proposed interpretation would encounter contradictory score evidence in this dataset.
Two score signals, two different instruments
The raw means clarify why this matters. Practice averages range from 28.4% in control to 66.9% with GPT Tutor. Unaided exam averages are much closer: 32.1%, 28.7%, and 31.5% for control, GPT Base, and GPT Tutor.
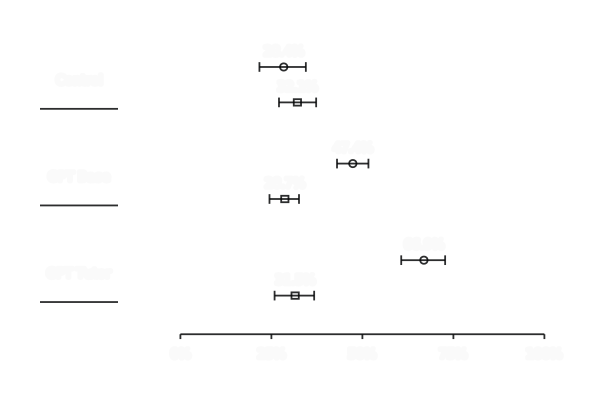
These are unadjusted summaries of the released non-honors sample. They are not a reproduction of the trial’s regression estimates, which use covariates and classroom-level uncertainty. The original paper reports a negative unaided-exam effect for GPT Base and no detectable exam effect for GPT Tutor relative to control. 1 Our conditional analysis asks a separate question about score interpretation.
It would be misleading to subtract 31.5 from 66.9 and declare that the guarded tutor “removed 35.4 points of learning.” The practice set and exam are different assessments. Difficulty, item mix, scoring granularity, and available resources differ. Equal percentage units do not make two tests interchangeable.
The control arm provides a useful reminder: its average exam score is higher than its average practice score. That does not establish that removing course materials improved knowledge. A difference between instruments can reflect the instruments themselves. The defensible finding is the observed relationship between two scores under stated conditions, with its denominator visible.
Uncertainty belongs to classrooms
A dataset with 2,899 rows is not an experiment with 2,899 independent units. Students share classrooms, and individual students appear repeatedly. Treating every row as an independent draw would ignore both kinds of dependence.
We therefore resample whole classrooms within each assigned arm, retaining every observed student session in each sampled classroom. Each bootstrap replicate draws the arm’s original number of classrooms with replacement, pools their records, and recomputes the ratio of counts. We use 10,000 replicates, a fixed random seed, and the 2.5th and 97.5th percentiles as the reported 95% intervals. Every primary replicate has a nonzero qualifying denominator.
This procedure preserves the observed dependence inside a classroom. It also preserves the session-weighted target: we do not average classroom percentages as though a classroom with two qualifying sessions supplied as much information as one with forty. The interval for a ratio is allowed to be asymmetric, as the control interval is here.
These intervals depend on a classroom-resampling model. With 13–17 classrooms per arm, they are approximate; they are not exact randomization intervals, and we do not reconstruct a stratified randomization distribution. They do not incorporate every source of uncertainty, such as alternative exam designs, missing attendance, or transfer to another school. A narrow interval cannot validate a poorly chosen mastery threshold.
We also remove one classroom at a time. The resulting conditional percentages range from 23.2–26.8% in control, 61.1–67.0% in GPT Base, and 65.0–70.0% in GPT Tutor. No single classroom produces the overall pattern. These deletion ranges are influence checks, not additional confidence intervals.
Does the finding depend on our choices?
An 80%/50% rule is a choice. A result that existed only at that exact boundary would offer little basis for a broader measurement argument. We therefore calculate the entire grid of practice thresholds at 60%, 70%, 80%, and 90%, crossed with exam thresholds at 40%, 50%, and 60%.
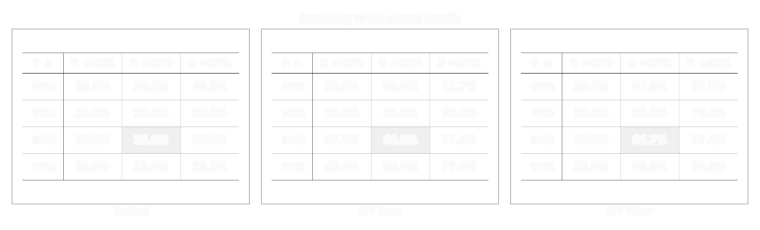
Both AI arms exceed control in all twelve combinations. The magnitudes vary substantially. With practice ≥90% and exam <50%, the conditional shares are 15.8%, 58.5%, and 63.5%. With practice ≥60% and exam <50%, they are 34.1%, 68.9%, and 67.6%. The ordering of GPT Base and GPT Tutor changes; the audit does not supply a stable ranking of the two systems.
The grid was specified before calculating these new summaries, after reading the original findings and inspecting the data schema. That makes this a documented exploratory analysis, not a preregistered confirmatory study. Its cells share observations and should not be counted as independent replications. The selected range also does not prove that every possible threshold yields the same relationship.
We next change the population or weighting while retaining the primary score rule:
| Analysis variant | Control | GPT Base | GPT Tutor |
|---|---|---|---|
| Main: non-honors, each session weighted equally | 25.6% | 64.5% | 66.7% |
| Include honors observations | 20.9% | 49.1% | 61.3% |
| Give each student equal total weight | 24.5% | 64.6% | 66.7% |
| Retain only students observed in all four sessions | 32.7% | 67.9% | 65.2% |
Including honors students reduces the GPT Base estimate considerably. A headline that presented 64.5% as a universal property of base AI would therefore be false. Equal student weighting changes little in this sample. Restricting to four-session attendees preserves the broad pattern, but conditions on attendance and may introduce selection of its own. It is a sensitivity check, not a correction for missing observations.
The pattern also appears separately in each grade and each session, with substantial variation:
| Subgroup | Control: low exam / high practice | GPT Base | GPT Tutor |
|---|---|---|---|
| Grade 9 | 7/32 (21.9%) | 27/40 (67.5%) | 124/176 (70.5%) |
| Grade 10 | 3/14 (21.4%) | 39/67 (58.2%) | 112/146 (76.7%) |
| Grade 11 | 12/40 (30.0%) | 14/17 (82.4%) | 82/155 (52.9%) |
| Session 1 | 2/22 (9.1%) | 16/32 (50.0%) | 29/73 (39.7%) |
| Session 2 | 9/32 (28.1%) | 11/23 (47.8%) | 71/115 (61.7%) |
| Session 3 | 3/17 (17.6%) | 33/43 (76.7%) | 91/140 (65.0%) |
| Session 4 | 8/15 (53.3%) | 20/26 (76.9%) | 127/149 (85.2%) |
Several denominators are small. The control estimate for Grade 10 rests on fourteen qualifying sessions. Session content also differs, so the larger percentages in later sessions cannot be read as evidence of accumulating dependency. These subgroup counts expose heterogeneity and fragility that a single pooled number would conceal; they do not establish subgroup treatment effects.
Why this is not a causal ranking
Random assignment protects comparisons of assigned groups before additional selection. It does not automatically protect comparisons after selecting students by an outcome that assignment can change.
Suppose prior knowledge and AI assistance can each increase a practice score. Without AI, reaching 80% may require relatively strong prior knowledge. With AI, the same threshold may admit students across a wider range of prior knowledge. Within the selected high-scoring group, assigned arm and prior knowledge can then become associated even though assignment was randomized in the full classroom sample. This is the familiar problem of conditioning on a common effect, often called collider selection. 4
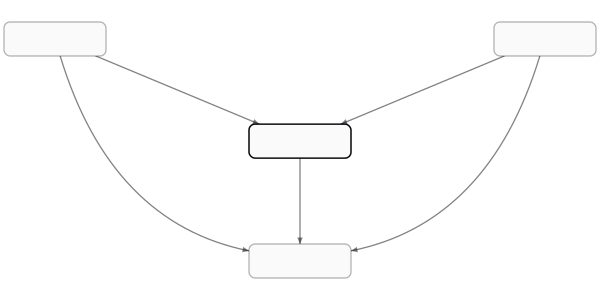
Our data make the change in selection visible: 8.0% of control sessions qualify, compared with 48.4% of GPT Tutor sessions. The high-practice groups contain 58 distinct control students and 226 distinct GPT Tutor students. A comparison of those selected groups is not a comparison of the same learners under alternative tutors.
Accordingly, 66.7% versus 25.6% does not show that GPT Tutor caused weaker learning. The guarded tutor could expand successful practice among learners who were initially struggling, leave their exam performance unchanged, and still generate this pattern. The original trial’s arm-level result and our descriptive finding can both be true.
Selection is a reason to limit the causal claim, but it does not erase the measurement finding. A teacher receiving a practice score still needs to know what that score predicts under the conditions that produced it. If assistance changes who reaches the threshold, a readiness rule inherited from another condition needs validation. The quantity we have estimated concerns that selected group, explicitly and intentionally.
How this fits the wider evidence
The literature does not support treating all AI tutoring as one intervention. Kestin and colleagues studied a different, deliberately designed AI tutor with undergraduate physics students. In a randomized crossover study involving two lessons, the AI condition produced higher immediate post-test performance than in-class active learning. 5 That result addresses a different population, instructional role, comparison, and assessment. It neither validates the practice threshold examined here nor contradicts the possibility of effective AI instruction. Immediate gains also leave delayed retention as a separate question.
The older assistance dilemma asks when support should be provided and when learners should generate more of the work themselves. 6 Our analysis adds a related measurement question: after deciding how much support to provide, how much independent competence can the resulting performance establish? Instruction and assessment have different jobs, even when a product records both through the same answer box.
Two non-AI findings help frame the next experiment without settling it. Retrieval-practice experiments found that testing can improve delayed retention relative to additional study under their experimental conditions. 7 Classroom research also found that students could learn more through active instruction while feeling that they learned less. 8 Neither study estimates the effect of the specific AI checkpoint proposed below. Together they caution against equating fluent completion or a positive feeling with a durable learning outcome.
A follow-up that could prove us wrong
The next research step is to test whether a short independent check adds useful information beyond an assisted practice score. We propose two stages, because evaluating a measurement rule and evaluating its educational consequences require different evidence. This is a study proposal, not a study we have conducted.
First, collect a baseline assessment, assisted practice, a brief unaided probe with unseen items, and a later unaided assessment in several schools. Specify the later outcome before collecting results: for example, performance one week later on separately authored items that test the same mathematical principles. Pilot the items for difficulty and scoring reliability. Predefine what counts as a consequential readiness error rather than borrowing our exploratory 80% and 50% thresholds.
During this measurement stage, keep the proposed readiness decision hidden so it does not change subsequent teaching. Give all participants the same scheduled probes and assessments. Compare a prediction rule using the baseline and practice score with a rule that also uses the independent probe. Record assistance conditions and test whether relationships differ across them. The hypothesis is that the probe improves prediction beyond information already available, not simply that a longer assessment predicts better than an empty one.
Evaluate both rules on students and classrooms excluded from model fitting. Hold out entire schools where feasible; never split repeated sessions from the same student across training and evaluation. Report calibration, prediction error such as the Brier score for a prespecified binary outcome, and uncertainty clustered at the appropriate school or classroom level. At the chosen decision rule, show both incorrect advancement and unnecessary withholding of advancement. A model that catches every struggling learner by advancing nobody has solved the wrong problem.
Second, if the probe adds useful information, randomize comparable classrooms to receive or not receive the resulting feedback policy. Assess the later outcome independently and score it without knowledge of condition where practical. Keep analysis by assignment, document attendance, and report results for learners with different starting knowledge. This stage asks whether acting on the information improves learning enough to justify the time and possible frustration it adds.
The proposal can fail. The probe may add no predictive value after baseline and practice are included. A useful predictor may fail to improve learning when shown to teachers. The burden may outweigh the benefit. A threshold may work in the development schools and fail elsewhere. Specify these failure conditions and a sample-size calculation using plausible cluster dependence before launching the study; this dataset does not establish the necessary effect size for that new intervention.
What these data leave unresolved
The analysis comes from one school, a particular mathematics intervention, and specific AI systems. It cannot establish a rate for current AI products, other subjects, younger learners, or EuraStudy. The public file supports an audit of recorded performance, not a census of all learners who might use AI assistance.
The exam occurs within the study session. It provides evidence about performance when resources are removed, not delayed retention or far transfer. Its score is also an imperfect measure. A binary threshold discards information, and a few points can move an observation across the line. The grid makes some of that dependence visible without eliminating it.
We have not inferred a mechanism from these aggregates. Copying, misunderstood hints, productive use of explanations, item difficulty, and differences in prior knowledge could contribute in different ways. We do not inspect or publish student conversations, and we do not infer individual intentions from a pair of scores.
Finally, this is not a full predictive validation study. The descriptive rule is evaluated in the same released data used for exploration. We report neither held-out accuracy nor a calibrated probability for a new learner. The result justifies testing an independent readiness measure; it does not supply a finished one.
Reproduce the analysis
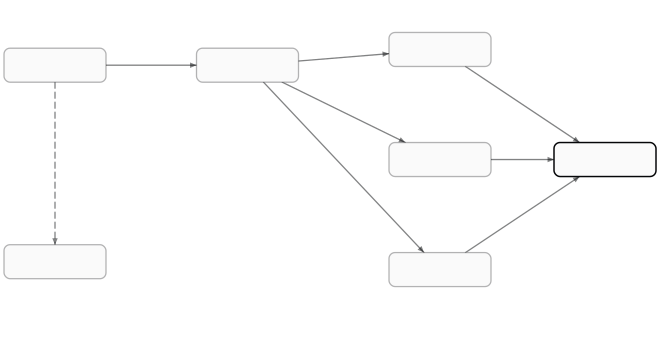
The analysis uses a pinned version of the authors’ replication repository. 2 Our script verifies the source file’s SHA-256 checksum before running, validates the data structure, and generates every reported aggregate. It resamples classrooms with seed 20260908 and 10,000 replicates. The figure specifications read those results directly and render through Hairline Atelier, the same diagram engine used across EuraStudy. No plotted observation or uncertainty interval was invented for illustration; Figure 05 alone is explicitly conceptual.
- Reproduction instructions and field definitions
- Analysis code, figure specifications and figure renderer, and pinned Python dependencies
- Complete results, including uncertainty and influence checks
- Main results CSV, threshold grid CSV, subgroup CSV, and sample sensitivity CSV
The downloads contain our code and aggregate results. Individual student records remain in the original authors’ repository. Each figure also opens as a full-size vector graphic. The method and cutoffs are documented so a reader can challenge the choices, rerun the work, and discover an error without taking the article’s authority on trust.
The educational implication is a narrower, more useful statement than “AI works” or “AI fails”: record the conditions under which success was achieved, and test the inference before using that success to certify independence. A practice score can be valuable evidence. Its meaning has to be earned.
References
- 1.Bastani, H., Bastani, O., Sungu, A., Ge, H., Kabakcı, Ö., & Mariman, R. (2025). Generative AI without guardrails can harm learning: Evidence from high school mathematics. Proceedings of the National Academy of Sciences, 122(26), e2422633122.
- 2.Bastani et al. Public replication repository, GenAICanHarmLearning. main_regressions/final_data.csv and main_analysis.R, commit 2f63dae1a01d51453826fe07ef5cf6678e339588. Retrieved 8 September 2026.
- 3.Soderstrom, N. C., & Bjork, R. A. (2015). Learning Versus Performance: An Integrative Review. Perspectives on Psychological Science, 10(2), 176–199.
- 4.Hernán, M. A., & Robins, J. M. (2020). Causal Inference: What If. Chapman & Hall/CRC. Part I, selection bias and conditioning on common effects.
- 5.Kestin, G., Miller, K., Klales, A., Milbourne, T., & Ponti, G. (2025). AI tutoring outperforms in-class active learning: an RCT introducing a novel research-based design in an authentic educational setting. Scientific Reports, 15, 17458.
- 6.Koedinger, K. R., & Aleven, V. (2007). Exploring the Assistance Dilemma in Experiments with Cognitive Tutors. Educational Psychology Review, 19, 239–264.
- 7.Roediger, H. L., III, & Karpicke, J. D. (2006). Test-Enhanced Learning: Taking Memory Tests Improves Long-Term Retention. Psychological Science, 17(3), 249–255.
- 8.Deslauriers, L., McCarty, L. S., Miller, K., Callaghan, K., & Kestin, G. (2019). Measuring actual learning versus feeling of learning in response to being actively engaged in the classroom. Proceedings of the National Academy of Sciences, 116(39), 19251–19257.